
Page 250 - Freshwater-Biology-and-Ecology-Handbook
P. 250
CHAPTER 5 3.1.24
SmartRivers
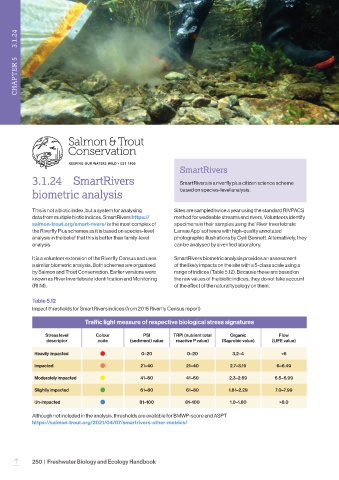
3.1.24 SmartRivers SmartRivers is a riverfly plus citizen science scheme
biometric analysis based on species-level analysis.
This is not a biotic index, but a system for analysing Sites are sampled twice a year using the standard RIVPACS
data from multiple biotic indices. SmartRivers https:// method for wadeable streams and rivers. Volunteers identify
salmon-trout.org/smart-rivers/ is the most complex of specimens in their samples using the ‘River Invertebrate
the Riverfly Plus schemes as it is based on species-level Larvae App’ software with high-quality annotated
analysis in the belief that this is better than family-level photographic illustrations by Cyril Bennett. Alternatively, they
analysis. can be analysed by a verified laboratory.
It is a volunteer extension of the Riverfly Census and uses SmartRivers biometric analysis provides an assessment
a similar biometric analysis. Both schemes are organised of the likely impacts on the site with a 5-class scale using a
by Salmon and Trout Conservation. Earlier versions were range of indices (Table 5.12). Because these are based on
known as River Invertebrate Identification and Monitoring the raw values of the biotic indices, they do not take account
(RIIM). of the effect of the natural typology on them.
Table 5.12
Impact thresholds for SmartRivers indices (from 2015 Riverfly Census report)
Traffic light measure of respective biological stress signatures
Stress level Colour PSI TRPI (nutrient total Organic Flow
descriptor code (sediment) value reactive P value) (Saprobic value) (LIFE value)
Heavily impacted 0–20 0–20 3.2–4 <6
Impacted 21–40 21–40 2.7–3.19 6–6.49
Moderately impacted 41–60 41–60 2.3–2.69 6.5–6.99
Slightly impacted 61–80 61–80 1.81–2.29 7.0–7.99
Un-impacted 81–100 81–100 1.0–1.80 >8.0
Although not included in the analysis, thresholds are available for BMWP-score and ASPT
https://salmon-trout.org/2021/04/07/smartrivers-other-metrics/
250 | Freshwater Biology and Ecology Handbook
–