
Page 265 - Freshwater-Biology-and-Ecology-Handbook
P. 265
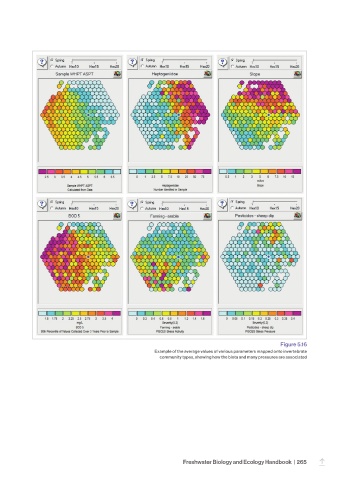
Figure 5.16
                                                       Example of the average values of various parameters mapped onto invertebrate
                                                         community types, showing how the biota and many pressures are associated


                                                                 Freshwater Biology and Ecology Handbook  |  265
                                                                                                                 –