
Page 243 - Freshwater-Biology-and-Ecology-Handbook
P. 243
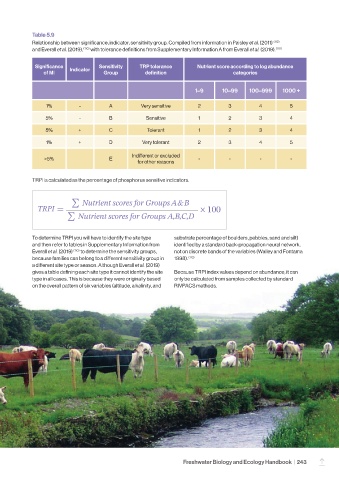
Table 5.9
            Relationship between significance, indicator, sensitivity group. Compiled from information in Paisley et al. (2011)  (112)
            and Everall et al. (2019),  (110)  with tolerance definitions from Supplementary Information A from Everall et al. (2019).  (110)


             Significance           Sensitivity   TRP tolerance       Nutrient score according to log abundance
                of MI     Indicator  Group          definition                     categories


                                                                      1–9      10–99     100–999    1000 +

                 1%          -         A           Very sensitive      2         3          4          5

                 5%          -         B            Sensitive          1         2          3          4

                 5%          +         C             Tolerant          1         2          3          4
                 1%          +         D           Very tolerant       2         3          4          5


                                               Indifferent or excluded
                 >5%                   E                               -         -          -          -
                                                 for other reasons

            TRPI is calculated as the percentage of phosphorus sensitive indicators.


            To determine TRPI you will have to identify the site type   substrate percentage of boulders, pebbles, sand and silt)
            and then refer to tables in Supplementary Information from   identified by a standard back-propagation neural network,
            Everall et al. (2019)  (110)  to determine the sensitivity groups,   not on discrete bands of the variables (Walley and Fontama
            because families can belong to a different sensitivity group in   1998).  (113)
            a different site type or season. Although Everall et al. (2019)
            gives a table defining each site type it cannot identify the site   Because TRPI index values depend on abundance, it can
            type in all cases. This is because they were originally based   only be calculated from samples collected by standard
            on the overall pattern of six variables (altitude, alkalinity, and   RIVPACS methods.


                                                                 Freshwater Biology and Ecology Handbook  |  243
                                                                                                                 –