
Page 238 - Freshwater-Biology-and-Ecology-Handbook
P. 238
CHAPTER 5 3.1.16 SPEAR pesticides was based on species-level data, but in the mid-2000s much of the monitoring data in the UK was from
family-level analyses, so a family-level version of the index was developed SPEAR(fm) pesticides, the species-level index
being designated SPEAR(sp) pesticides.
Definitions of family at risk or not at risk for SPEAR(fm) pesticides were derived from data in the database for the majority
of the species comprising the family (above 50 per cent), so all species from a particular family have the same family-
level SPEAR definition. As for species, defining the ‘families at risk’ was performed automatically by the algorithm in the
database. SPEAR definitions for 152 families were created including 66 families at risk, 83 not at risk, and three that were
not found in the UK.
The performance of SPEAR pesticides was validated in Europe by comparing it with an index derived from chemical
monitoring data. This index is the maximum chemical Toxic Unit (TU max), based on the maximum peak water
concentration of all the pesticide data collected on a sampling visit. A tool for calculating this index is included in the
SPEAR Calculator.
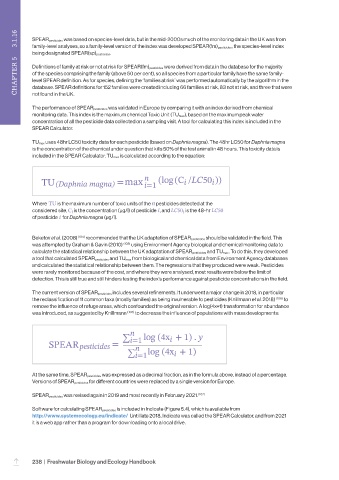
TU max uses 48hr LC50 toxicity data for each pesticide (based on Daphnia magna). The 48hr LC50 for Daphnia magna
is the concentration of the chemical under question that kills 50% of the test animal in 48 hours. This toxicity data is
included in the SPEAR Calculator. TU max is calculated according to the equation:
Where is the maximum number of toxic units of the pesticides detected at the
is the concentration (μg/l) of pesticide , and is the 48-hr
considered site,
of pesticide for Daphnia magna (μg/l).
Beketov et al. (2008) (104) recommended that the UK adaptation of SPEAR pesticides should be validated in the field. This
was attempted by Graham & Gavin (2010) (105) using Environment Agency biological and chemical monitoring data to
calculate the statistical relationship between the UK adaptation of SPEAR pesticides and TU max. To do this, they developed
a tool that calculated SPEAR pesticides and TU max from biological and chemical data from Environment Agency databases
and calculated the statistical relationship between them. The regressions that they produced were weak. Pesticides
were rarely monitored because of the cost, and where they were analysed, most results were below the limit of
detection. This is still true and still hinders testing the index’s performance against pesticide concentrations in the field.
The current version of SPEAR pesticides includes several refinements. It underwent a major change in 2018, in particular
the reclassification of 11 common taxa (mostly families) as being invulnerable to pesticides (Knillmann et al. 2018) (106) to
remove the influence of refuge areas, which confounded the original version. A log(4x+1) transformation for abundance
was introduced, as suggested by Knillmann (106) to decrease the influence of populations with mass developments:
At the same time, SPEAR pesticides was expressed as a decimal fraction, as in the formula above, instead of a percentage.
Versions of SPEAR pesticides for different countries were replaced by a single version for Europe.
SPEAR pesticides was revised again in 2019 and most recently in February 2021. (107)
Software for calculating SPEAR pesticides is included in Indicate (Figure 5.4), which is available from
http://www.systemecology.eu/indicate/ Until late 2018, Indicate was called the SPEAR Calculator, and from 2021
it is a web app rather than a program for downloading onto a local drive.
238 | Freshwater Biology and Ecology Handbook
–