
Page 75 - Freshwater-Biology-and-Ecology-Handbook
P. 75
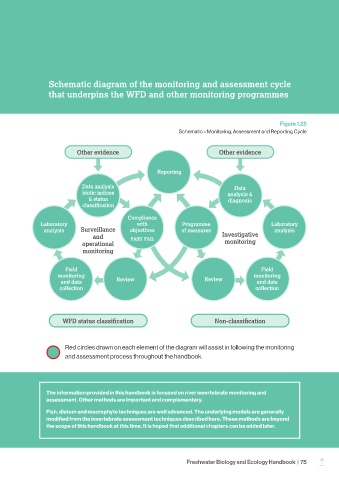
Schematic diagram of the monitoring and assessment cycle

                  that underpins the WFD and other monitoring programmes


                                                                                                   Figure 1.25
                                                                Schematic – Monitoring, Assessment and Reporting Cycle


                            Other evidence                                    Other evidence


                                                        Reporting

                              Data analysis                                        Data
                              biotic indices                                     analysis &
                                & status                                         diagnosis
                              classification

                                              Compliance
               Laboratory                        with            Programme                      Laboratory
                analysis     Surveillance      objectives        of measures                     analysis
                                  and          PASS  FAIL                      Investigative
                              operational                                       monitoring
                              monitoring


                        Field                                                                Field
                     monitoring                                                           monitoring
                      and data            Review                         Review            and data
                      collection                                                           collection


                       WFD status classification                            Non-classification


                        Red circles drawn on each element of the diagram will assist in following the monitoring
                        and assessment process throughout the handbook.


                 The information provided in this handbook is focused on river invertebrate monitoring and
                 assessment. Other methods are important and complementary.

                 Fish, diatom and macrophyte techniques are well advanced. The underlying models are generally
                 modified from the invertebrate assessment techniques described here. These methods are beyond
                 the scope of this handbook at this time. It is hoped that additional chapters can be added later.


                                                                   Freshwater Biology and Ecology Handbook  |  75
                                                                                                                 –