
Page 116 - Freshwater-Biology-and-Ecology-Handbook
P. 116
CHAPTER 2 12.4.3 12.4.3 Sorting process Sort the whole of the first tray to assess what proportion
The same methods are used for sorting live and preserved
samples.
you should aim to sort in detail, then work out the number of
squares in the sorting tray that represents that proportion.
Sort this number of squares in each remaining tray but select
Identification is much easier with live specimens, particularly
which squares to sort at random.
flatworms and leeches, but they must be analysed within
48 hours of collection. Some animals are almost impossible
to identify to species level when preserved. However,
preserving samples makes it easier to balance workloads. Take all the specimens out of these squares and place them
in a Petri dish or vial for identification. You must scan the
remaining squares for new taxa, but store these separately
Preservative must be washed thoroughly from preserved as you may find more in squares for detailed sorting in the
samples with tap water before they are sorted. rest of the sample. It is helpful if visually similar taxa are
stored together.
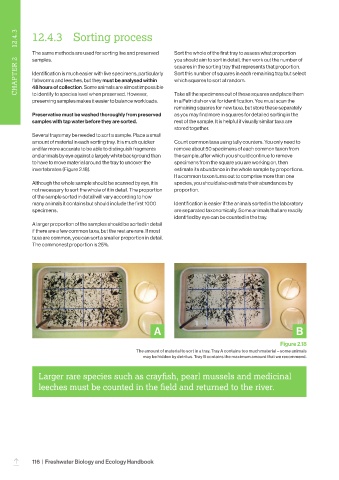
Several trays may be needed to sort a sample. Place a small
amount of material in each sorting tray. It is much quicker Count common taxa using tally counters. You only need to
and far more accurate to be able to distinguish fragments remove about 50 specimens of each common taxon from
and animals by eye against a largely white background than the sample, after which you should continue to remove
to have to move material around the tray to uncover the specimens from the square you are working on, then
invertebrates (Figure 2.18). estimate its abundance in the whole sample by proportions.
If a common taxon turns out to comprise more than one
Although the whole sample should be scanned by eye, it is species, you should also estimate their abundances by
not necessary to sort the whole of it in detail. The proportion proportion.
of the sample sorted in detail will vary according to how
many animals it contains but should include the first 1000 Identification is easier if the animals sorted in the laboratory
specimens. are separated taxonomically. Some animals that are readily
identified by eye can be counted in the tray.
A larger proportion of the samples should be sorted in detail
if there are a few common taxa, but the rest are rare. If most
taxa are common, you can sort a smaller proportion in detail.
The commonest proportion is 25%.
A B
Figure 2.18
The amount of material to sort in a tray. Tray A contains too much material – some animals
may be hidden by detritus. Tray B contains the maximum amount that we recommend.
Larger rare species such as crayfish, pearl mussels and medicinal
leeches must be counted in the field and returned to the river.
116 | Freshwater Biology and Ecology Handbook
–