
Page 226 - Freshwater-Biology-and-Ecology-Handbook
P. 226
CHAPTER 5 3.1.6 – 3.1.7 Organic loading and hence its breakdown (saprobity) matter, the saprobic scale is intimately related to the
in surface waters can be generated by autotrophic
eutrophic scale and therefore to the chemical indicators
production by aquatic plants and algae – a process known
of eutrophication, though the concentrations vary
between different types of surface waters, hence differing
as autosaprobity – and the input of allochthonous organic
nutrient standards in rivers and lakes. However, this direct
matter from leaves, run-off and waste discharges is
termed allosaprobity. Because nitrogen and phosphorus
relationship is sometimes forgotten, and nutrient standards
compounds are released by the breakdown of organic
can be misaligned to standards for organic loading.
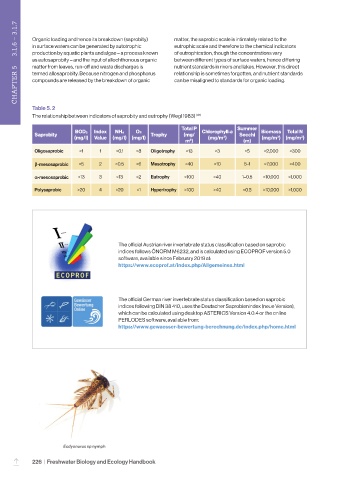
Table 5. 2
The relationship between indicators of saprobity and eutrophy (Wegl 1983) (81)
Total P Chlorophyll-a Summer Biomass Total N
Index
O2
Saprobity BOD5 NH4 Trophy (mg/ Secchi
(mg/l) Value (mg/l) (mg/l) (mg/m ) (mg/m ) (mg/m )
3
3
3
3
m ) (m)
Oligosaprobic <1 1 <0.1 >8 Oligotrophy <13 <3 >5 <2,000 <300
β-mesosaprobic <5 2 <0.5 >6 Mesotrophy <40 <10 5–1 <7,000 <400
α-mesosaprobic <13 3 <13 >2 Eutrophy <100 <40 1–0.5 <10,000 <1,000
Polysaprobic >20 4 >20 <1 Hypertrophy >100 >40 <0.5 >10,000 >1,000
The official Austrian river invertebrate status classification based on saprobic
indices follows ÖNORM M6232, and is calculated using ECOPROF version 5.0
software, available since February 2019 at:
https://www.ecoprof.at/index.php/Allgemeines.html
The official German river invertebrate status classification based on saprobic
indices following DIN 38 410, uses the Deutscher Saprobienindex (neue Version),
which can be calculated using desktop ASTERICS Version 4.0.4 or the online
PERLODES software, available from:
https://www.gewaesser-bewertung-berechnung.de/index.php/home.html
Ecdyonurus sp nymph
226 | Freshwater Biology and Ecology Handbook
–