
Page 229 - Freshwater-Biology-and-Ecology-Handbook
P. 229
3.1.9 LIFE (Lotic-invertebrate Index for Flow Evaluation)
The Lotic-invertebrate Index for Flow Evaluation was Different index values (flow scores) are given to each taxon
developed by Chris Extence and his colleagues in Anglian depending on its flow group and abundance and the index
Region of the Environment Agency to assess the potential is expressed as an average (flow score) per taxon. LIFE
impact of flow-related stresses on river invertebrate uses the same log abundance categories as RIVPACS,
10
communities (Extence et al. 1999). (89) LIFE is used by the but designated A–E rather than 1–5 to avoid confusion
Environment Agency for Hydroecological Validation (HEV) with Flow Groups. LIFE should only be calculated from
to help manage water resources. standard RIVPACS samples (described in Chapter 2).
LIFE has been incorporated in RIVPACS (Clarke et al.
LIFE – Lotic-invertebrate Index 2003) (90) so that it can be standardised across river
for Flow Evaluation types as O/E ratios. This is the form in which it is used for
Hydroecological Validation (see Section 3.2.5). LIFE can
vary between seasons, so spring and autumn samples are
LIFE index relates to the flow velocity preferences of analysed independently, and impact is generally based on
invertebrates and is used to evaluate flow pressures. the season indicating poorest quality.
A LIFE index has been developed for New Zealand
Each species or family is assigned to one of six flow (Greenwood et al. 2016) (91) using the same principles as
groups according to their perceived association with the UK version.
different flow conditions, although many taxa can be found
in a range of habitats and flow types (Table 5.4). LIFE can
be calculated for families LIFE(F) or for species LIFE(S).
LIFE includes some estuarine families that are not found in
purely freshwaters because saline intrusion is a common
effect of reduced flows in the most downstream reaches of
watercourses.
Table 5. 4
Flow associations used in LIFE
Group Primary flow association Typical mean current velocity
I Rapid >100 cm.s -1
II Moderate to fast 20–100 cm.s -1
III Slow to sluggish < 20 cm.s -1
IV Flowing (usually slow) and standing waters
V Standing waters
VI Drying or drought-impacted sites
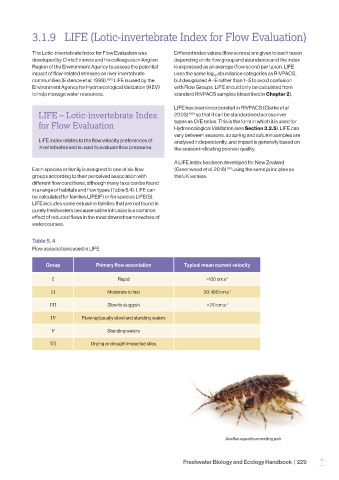
Asellus aquaticus mating pair
Freshwater Biology and Ecology Handbook | 229
–