
Page 83 - Freshwater-Biology-and-Ecology-Handbook
P. 83
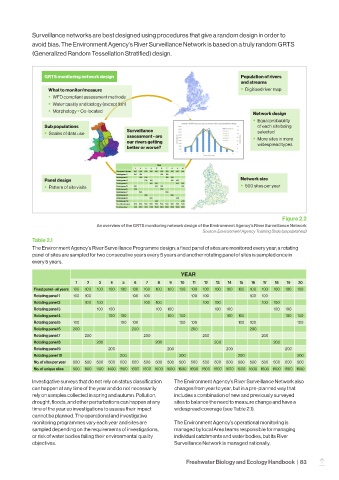
Surveillance networks are best designed using procedures that give a random design in order to
            avoid bias. The Environment Agency’s River Surveillance Network is based on a truly random GRTS
            (Generalized Random Tessellation Stratified) design.


                 GRTS monitoring network design                                       Population of rivers
                                                                                      and streams
                  What to monitor/measure                                             •  Digitised river map
                  •  WFD compliant assessment methods
                  •  Water quality and biology (except fish)
                  •  Morphology • Co-located                                              Network design
                                                                                          •  Equal probability
                 Sub populations                                                           of each site being
                 •  Scales of data use        Surveillance                                 selected
                                              assessment - are                            •  More sites in more
                                              our rivers getting                           widespread types
                                              better or worse?


                                                        YEAR
                                                1  2  3  4  5  6  7  8  9  10
                                          Fixed panel - all years  100  100  100  100  100  100  100  100  100  100
                                          Rotating panel 1  100  100  100  100
                                          Rotating panel 2  100  100  100  100
                 Panel design             Rotating panel 3  100  100  100  100        Network size
                                          Rotating panel 4  100  100  100  100
                 •  Pattern of site visits  Rotating panel 5  100  100  100  100      •  500 sites per year
                                          Rotating panel 6  200  200
                                          Rotating panel 7  200  200
                                          Rotating panel 8  200  200
                                          Rotating panel 9  200  200
                                          Rotating panel 10  200  200
                                          No. of sites this year  500  500  500  500  500  500  500  500  500  500
                                          No. unique sites  500  800  1100  1400 1600 1600 1600 1600 1600 1600
                                                                                                    Figure 2.2
                                   An overview of the GRTS monitoring network design of the Environment Agency’s River Surveillance Network
                                                                        Source: Environment Agency Training Slide (unpublished)
            Table 2.1
            The Environment Agency’s River Surveillance Programme design: a fixed panel of sites are monitored every year; a rotating
            panel of sites are sampled for two consecutive years every 5 years and another rotating panel of sites is sampled once in
            every 5 years.
                                                                 YEAR
                            1   2   3   4   5   6   7   8    9  10   11  12  13  14  15  16  17   18  19  20
             Fixed panel - all years  100  100  100  100  100  100  100  100  100  100  100  100  100  100  100  100  100  100  100  100
             Rotating panel 1  100  100         100  100            100  100             100  100
             Rotating panel 2  100  100             100  100            100  100             100  100
             Rotating panel 3      100  100             100  100            100  100             100  100
             Rotating panel 4          100  100             100  100             100  100            100  100
             Rotating panel 5  100         100  100             100  100             100  100            100
             Rotating panel 6  200             200                  200                  200
             Rotating panel 7  200                  200                 200                  200
             Rotating panel 8      200                  200                 200                  200
             Rotating panel 9          200                  200                 200                  200
             Rotating panel 10             200                  200                  200                 200
             No. of sites per year  500  500  500  500  500  500  500  500  500  500  500  500  500  500  500  500  500  500  500  500
             No. of unique sites  500  800  1100  1400 1600 1600 1600 1600 1600 1600 1600 1600 1600 1600 1600 1600 1600 1600 1600 1600

            Investigative surveys that do not rely on status classification   The Environment Agency’s River Surveillance Network also
            can happen at any time of the year and do not necessarily   changes from year to year, but in a pre-planned way that
            rely on samples collected in spring and autumn. Pollution,   includes a combination of new and previously surveyed
            drought, floods, and other perturbations can happen at any   sites to balance the need to measure change and have a
            time of the year so investigations to assess their impact   widespread coverage (see Table 2.1).
            cannot be planned. The operational and investigative
            monitoring programmes vary each year and sites are   The Environment Agency’s operational monitoring is
            sampled depending on the requirements of investigations,   managed by local Area teams responsible for managing
            or risk of water bodies failing their environmental quality   individual catchments and water bodies, but its River
            objectives.                                       Surveillance Network is managed nationally.


                                                                  Freshwater Biology and Ecology Handbook  |  83
                                                                                                                 –