
Page 171 - Freshwater-Biology-and-Ecology-Handbook
P. 171
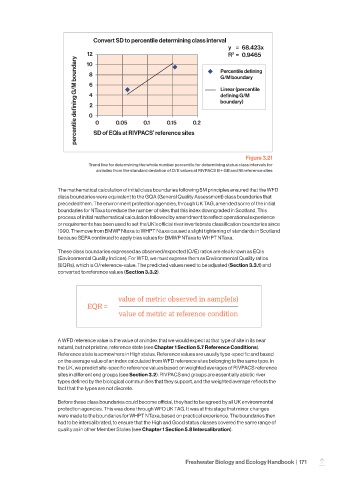
Convert SD to percentile determining class interval
                                                                                 y  =  68.423x
                                12                                            Percentile defining
                                                                                   2
                                                                                 R  =  0.9465
                            percentile defining G/M boundary  0  0  0.05  0.1  0.15  0.2  Linear (percentile
                               10
                                8
                                                                              G/M boundary
                                6
                                4
                                                                              defining G/M
                                                                              boundary)
                                2


                                  SD of  EQls at RIVPACS’ reference sites


                                                                                       Figure 3.21
                                Trend line for determining the whole number percentile for determining status class intervals for
                                   an index from the standard deviation of O/E values at RIVPACS III+ GB and NI reference sites


                     The mathematical calculation of initial class boundaries following 5M principles ensured that the WFD
                     class boundaries were equivalent to the GQA (General Quality Assessment) class boundaries that
                     preceded them. The environment protection agencies, through UK TAG, amended some of the initial
                     boundaries for NTaxa to reduce the number of sites that this index downgraded in Scotland. This
                     process of initial mathematical calculation followed by amendment to reflect operational experience
                     or requirements has been used to set the UK’s official river invertebrate classification boundaries since
                     1990. The move from BMWP Ntaxa to WHPT Ntaxa caused a slight tightening of standards in Scotland
                     because SEPA continued to apply bias values for BMWP NTaxa to WHPT NTaxa.
                     These class boundaries expressed as observed/expected (O/E) ratios are also known as EQIs
                     (Environmental Quality Indices). For WFD, we must express them as Environmental Quality ratios
                     (EQRs), which is O/reference-value. The predicted values need to be adjusted (Section 3.3.1) and
                     converted to reference values (Section 3.3.2).


                                          value of metric observed in sample(s)
                                EQR =
                                          value of metric at reference condition


                     A WFD reference value is the value of an index that we would expect at that type of site in its near
                     natural, but not pristine, reference state (see Chapter 1 Section 5.7 Reference Conditions).
                     Reference state is somewhere in High status. Reference values are usually type-specific and based
                     on the average value of an index calculated from WFD reference sites belonging to the same type. In
                     the UK, we predict site-specific reference values based on weighted averages of RIVPACS reference
                     sites in different end groups (see Section 3.2). RIVPACS end groups are essentially abiotic river
                     types defined by the biological communities that they support, and the weighted average reflects the
                     fact that the types are not discrete.


                     Before these class boundaries could become official, they had to be agreed by all UK environmental
                     protection agencies. This was done through WFD UK TAG. It was at this stage that minor changes
                     were made to the boundaries for WHPT NTaxa, based on practical experience. The boundaries then
                     had to be intercalibrated, to ensure that the High and Good status classes covered the same range of
                     quality as in other Member States (see Chapter 1 Section 5.8 Intercalibration).


                                                                  Freshwater Biology and Ecology Handbook  |  171
                                                                                                                 –