
Page 170 - Freshwater-Biology-and-Ecology-Handbook
P. 170
CHAPTER 3 4.2 4.2 Setting status class boundaries for WHPT
indices using RIVPACS
This section explains how the class boundaries of the river
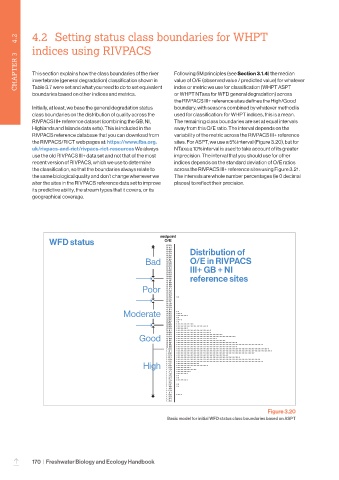
Following 5M principles (see Section 3.1.4) the median
invertebrate (general degradation) classification shown in
index or metric we use for classification (WHPT ASPT
Table 3.7 were set and what you need to do to set equivalent
or WHPT NTaxa for WFD general degradation) across
boundaries based on other indices and metrics. value of O/E (observed value / predicted value) for whatever
the RIVPACS III+ reference sites defines the High/Good
Initially, at least, we base the general degradation status boundary, with seasons combined by whatever method is
class boundaries on the distribution of quality across the used for classification: for WHPT indices, this is a mean.
RIVPACS III+ reference dataset (combining the GB, NI, The remaining class boundaries are set at equal intervals
Highlands and Islands data sets). This is included in the away from this O/E ratio. The interval depends on the
RIVPACS reference database that you can download from variability of the metric across the RIVPACS III+ reference
the RIVPACS/RICT web pages at: https://www.fba.org. sites. For ASPT, we use a 5% interval (Figure 3.20), but for
uk/rivpacs-and-rict/rivpacs-rict-resources We always NTaxa a 10% interval is used to take account of its greater
use the old RIVPACS III+ data set and not that of the most imprecision. The interval that you should use for other
recent version of RIVPACS, which we use to determine indices depends on the standard deviation of O/E ratios
the classification, so that the boundaries always relate to across the RIVPACS III+ reference sites using Figure 3.21.
the same biological quality and don’t change whenever we The intervals are whole number percentages (ie 0 decimal
alter the sites in the RIVPACS reference data set to improve places) to reflect their precision.
its predictive ability, the stream types that it covers, or its
geographical coverage.
midpoint
WFD status O/E
0.50
0. 51
0.52
0.53 Distribution of
0.54
0.55
0.56
Bad 0. 57 O/E in RIVPACS
0.58
0.59
0.60
0 .6 1 III+ GB + NI
0.62
0.63
0.64
0.65
0.66 reference sites
0. 67
0. 68
0. 69
Poor 0. 70
0 .7 1
0.7 2
0.7 3
0 .74 ..
0.75
0.76
0.7 7
0.78
0.79
0.80 ..
Moderate 0.82 ....
0. 8 1
........
0.83
0.84
....
0.85 ..
0.86 ..
0.87 ............
0.88 ......................
0.89 ........
0.90 ........................
0. 9 1 ........................
0.92 ................................
.........................................
0.93
Good 0.94 ............................
..................................
0. 95
0. 96
............................................................
0. 97 ..........................................
0. 98 ..........................................
0. 99 ................................................................
1. 00 ..................................................................
1 .0 1 ......................................................
1 .0 2 ....................................
1. 03 ............................................
1. 04 ..........................................................
1 .0 5 ............................................................
................
1. 06
High 1 . 07 ......................
..........
1 .0 8
1 .0 9
..........
1. 10 ..............
1. 11 ........
1. 12 ..
1. 13 ..
1. 14 ........
1. 15
1. 16 ..
1. 17 ..
1. 18
1. 19
1.20
1.2 1 ....
1.2 2
1.23
1.2 4
1.25
Figure 3.20
Basic model for initial WFD status class boundaries based on ASPT
170 | Freshwater Biology and Ecology Handbook
–