
Page 284 - Freshwater-Biology-and-Ecology-Handbook
P. 284
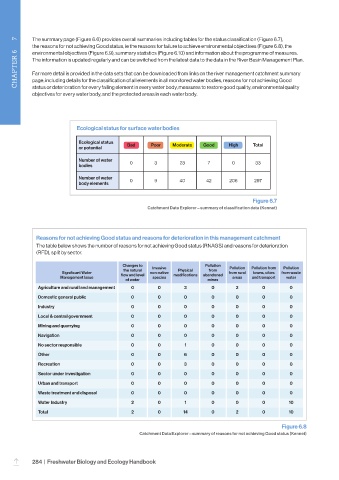
CHAPTER 6     7  The summary page (Figure 6.6) provides overall summaries including tables for the status classification (Figure 6.7),
            the reasons for not achieving Good status, ie the reasons for failure to achieve environmental objectives (Figure 6.8), the
            environmental objectives (Figure 6.9), summary statistics (Figure 6.10) and information about the programme of measures.
            The information is updated regularly and can be switched from the latest data to the data in the River Basin Management Plan.


            Far more detail is provided in the data sets that can be downloaded from links on the river management catchment summary
            page, including details for the classification of all elements in all monitored water bodies, reasons for not achieving Good
            status or deterioration for every failing element in every water body, measures to restore good quality, environmental quality
            objectives for every water body, and the protected areas in each water body.


                            Ecological status for surface water bodies


                             Ecological status
                             or potential     Bad     Poor    Moderate  Good     High     Total
                             Number of water   0       3        23        7        0       33
                             bodies
                             Number of water   0       9        40       42       206     297
                             body elements

                                                                                          Figure 6.7
                                                     Catchment Data Explorer – summary of classification data (Kennet)


              Reasons for not achieving Good status and reasons for deterioration in this management catchment
              The table below shows the number of reasons for not achieving Good status (RNAGS) and reasons for deterioration
              (RFD), split by sector.

                                            Changes to                   Pollution
                                                      Invasive                    Pollution   Pollution from   Pollution
                       Significant Water    the natural   non-native   Physical   from   from rural   towns, cities   from waste
                      Management Issue     flow and level   species  modifications  abandoned   areas  and transport  water
                                             of water                     mines
              Agriculture and rural land management  0  0         3        0        2        0         0
              Domestic general public          0        0         0        0        0        0         0

              Industry                         0        0         0        0        0        0         0
              Local & central government       0        0         0        0        0        0         0
              Mining and quarrying             0        0         0        0        0        0         0
              Navigation                       0        0         0        0        0        0         0
              No sector responsible            0        0         1        0        0        0         0
              Other                            0        0         6        0        0        0         0
              Recreation                       0        0         3        0        0        0         0
              Sector under investigation       0        0         0        0        0        0         0
              Urban and transport              0        0         0        0        0        0         0

              Waste treatment and disposal     0        0         0        0        0        0         0
              Water Industry                   2        0         1        0        0        0        10
              Total                            2        0        14        0        2        0        10

                                                                                                    Figure 6.8
                                                  Catchment Data Explorer – summary of reasons for not achieving Good status (Kennet)


            284  |  Freshwater Biology and Ecology Handbook
      –