
Page 286 - Freshwater-Biology-and-Ecology-Handbook
P. 286
CHAPTER 6 8 – 9 8
ENGLAND – BIOLOGICAL
QUALITY MAPPING
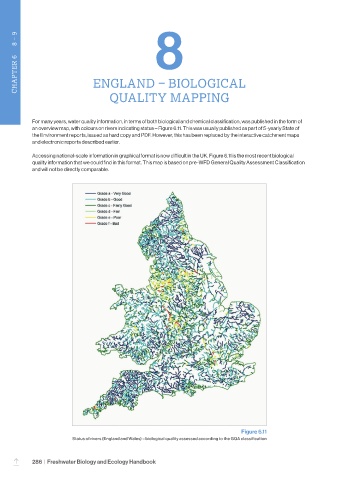
For many years, water quality information, in terms of both biological and chemical classification, was published in the form of
an overview map, with colours on rivers indicating status – Figure 6.11. This was usually published as part of 5-yearly State of
the Environment reports, issued as hard copy and PDF. However, this has been replaced by the interactive catchment maps
and electronic reports described earlier.
Accessing national-scale information in graphical format is now difficult in the UK. Figure 6.11 is the most recent biological
quality information that we could find in this format. This map is based on pre-WFD General Quality Assessment Classification
and will not be directly comparable.
Figure 6.11
Status of rivers (England and Wales) – biological quality assessed according to the GQA classification
286 | Freshwater Biology and Ecology Handbook
–