
Page 285 - Freshwater-Biology-and-Ecology-Handbook
P. 285
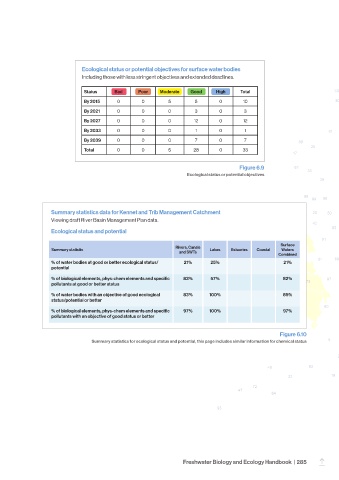
Ecological status or potential objectives for surface water bodies
                              Including those with less stringent objectives and extended deadlines.


                               Status    Bad      Poor   Moderate   Good     High    Total
                               By 2015    0        0        5        5        0       10
                               By 2021    0        0        0        3        0        3
                               By 2027    0        0        0        12       0       12
                               By 2033    0        0        0         1       0        1
                               By 2039    0        0        0         7       0        7
                               Total      0        0        5        28       0       33


                                                                                     Figure 6.9
                                                                   Ecological status or potential objectives


                   Summary statistics data for Kennet and Trib Management Catchment
                   Viewing draft River Basin Management Plan data.
                   Ecological status and potential

                                                                                                    Surface
                                                               Rivers, Canals
                   Summary statistic                                       Lakes  Estuaries  Coastal  Waters
                                                                and SWTs
                                                                                                   Combined
                   % of water bodies at good or better ecological status/  21%  25%                  21%
                   potential
                   % of biological elements, phys-chem elements and specific   83%  57%             82%
                   pollutants at good or better status
                   % of water bodies with an objective of good ecological   83%  100%               85%
                   status/potential or better

                   % of biological elements, phys-chem elements and specific   97%  100%            97%
                   pollutants with an objective of good status or better

                                                                                                   Figure 6.10
                                 Summary statistics for ecological status and potential, this page includes similar information for chemical status


                                                                 Freshwater Biology and Ecology Handbook  |  285
                                                                                                                 –