
Page 292 - Freshwater-Biology-and-Ecology-Handbook
P. 292
CHAPTER 6 10.1.2 10.1.2 Trends and patterns revealed by Environment
Agency monitoring data
There have been surprisingly few analyses of the long-term
There was concern that this improving trend had ceased
or even reversed, but a recent extension of Vaughan and
trends in the ecological quality of English rivers. Globally,
Ormerod’s studies indicate that although increases in
there is evidence that freshwater insects are not suffering
the declines observed in terrestrial insect communities
(149)
Analysis of Environment Agency
of invertebrate taxa that are sensitive to oxygen and organic
(Outhwaite et al. 2020).
pollutants continues to improve (Pharaoh et al. 2021).
(152)
monitoring data by Vaughan and Ormerod (2012, 2014) taxonomic richness have slowed or halted, the proportion
at Cardiff University suggest that this is also true of the https://www.gov.uk/government/publications/an-
invertebrate faunas in English rivers. (150) (151) analysis-of-national-macroinvertebrate-trends-for-
england-1991-2019
The original aim of their evaluation was to show the impact
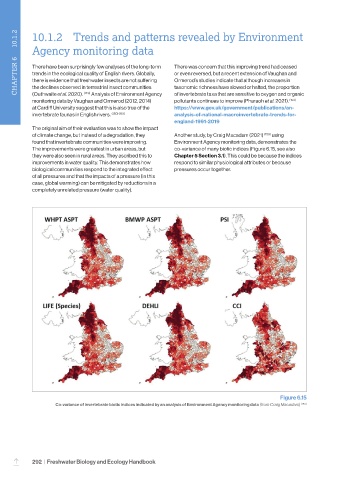
of climate change, but instead of a degradation, they Another study, by Craig Macadam (2021) (153) using
found that invertebrate communities were improving. Environment Agency monitoring data, demonstrates the
The improvements were greatest in urban areas, but co-variance of many biotic indices (Figure 6.15, see also
they were also seen in rural areas. They ascribed this to Chapter 5 Section 3.1). This could be because the indices
improvements in water quality. This demonstrates how respond to similar physiological attributes or because
biological communities respond to the integrated effect pressures occur together.
of all pressures and that the impacts of a pressure (in this
case, global warming) can be mitigated by reductions in a
completely unrelated pressure (water quality).
Figure 6.15
Co-variance of invertebrate biotic indices indicated by an analysis of Environment Agency monitoring data (from Craig Macadam) (153)
292 | Freshwater Biology and Ecology Handbook
–