
Page 291 - Freshwater-Biology-and-Ecology-Handbook
P. 291
In response to these concerns, and to optimise this years once every 5 years, and others only once every
reduced monitoring resource, the Environment Agency 5 years. The whole programme will be repeated every
initiated a new River Surveillance Monitoring Network in 5 years and comprises 1600 sites (Table 6.3). Sites are
2021. Its aim is to provide a measure of the overall quality of selected randomly from a 1:50,000 scale river network
rivers in England and to enable changes in quality, at large to ensure that the surveillance network is unbiased. The
scale, to be detected and measured. network includes small and ephemeral streams that are
known to be important (Riley et al. 2018) (148) but were not
This is a minimal programme in which 500 sites are covered adequately by previous monitoring networks. It
monitored each year using a generalised random excludes artificial drainage ditches. Unlike the operational
tessellation stratified (GRTS) design that balances the programme, sites are not designed to assess the quality
need to measure change with the need for extensive of individual water bodies, but to be analysed together to
and unbiased geographical coverage. Some sites are provide wider-scale information. The network therefore
surveyed every year, but to increase the geographical complements the operational network but does not
coverage, other sites are surveyed for two consecutive contribute to it.
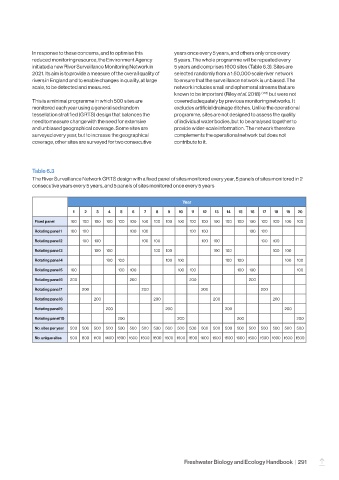
Table 6.3
The River Surveillance Network GRTS design with a fixed panel of sites monitored every year, 5 panels of sites monitored in 2
consecutive years every 5 years, and 5 panels of sites monitored once every 5 years
Year
1 2 3 4 5 6 7 8 9 10 11 12 13 14 15 16 17 18 19 20
Fixed panel 100 100 100 100 100 100 100 100 100 100 100 100 100 100 100 100 100 100 100 100
Rotating panel 1 100 100 100 100 100 100 100 100
Rotating panel 2 100 100 100 100 100 100 100 100
Rotating panel 3 100 100 100 100 100 100 100 100
Rotating panel 4 100 100 100 100 100 100 100 100
Rotating panel 5 100 100 100 100 100 100 100 100
Rotating panel 6 200 200 200 200
Rotating panel 7 200 200 200 200
Rotating panel 8 200 200 200 200
Rotating panel 9 200 200 200 200
Rotating panel 10 200 200 200 200
No. sites per year 500 500 500 500 500 500 500 500 500 500 500 500 500 500 500 500 500 500 500 500
No. unique sites 500 800 1100 1400 1600 1600 1600 1600 1600 1600 1600 1600 1600 1600 1600 1600 1600 1600 1600 1600
Freshwater Biology and Ecology Handbook | 291
–