
Page 290 - Freshwater-Biology-and-Ecology-Handbook
P. 290
CHAPTER 6 10.1.1 10.1.1 Resource pressure on monitoring programmes
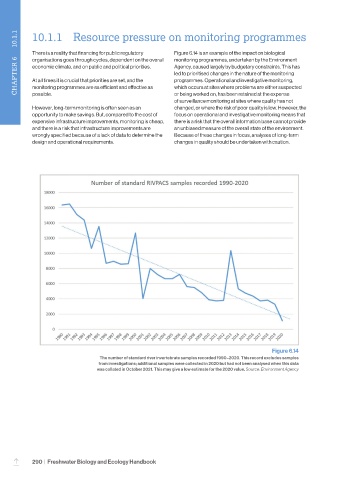
Figure 6.14 is an example of the impact on biological
There is a reality that financing for public regulatory
monitoring programmes, undertaken by the Environment
organisations goes through cycles, dependent on the overall
Agency, caused largely by budgetary constraints. This has
economic climate, and on public and political priorities.
led to prioritised changes in the nature of the monitoring
programmes. Operational and investigative monitoring,
At all times it is crucial that priorities are set, and the
monitoring programmes are as efficient and effective as
which occurs at sites where problems are either suspected
or being worked on, has been retained at the expense
possible.
of surveillance monitoring at sites where quality has not
However, long-term monitoring is often seen as an changed, or where the risk of poor quality is low. However, the
opportunity to make savings. But, compared to the cost of focus on operational and investigative monitoring means that
expensive infrastructure improvements, monitoring is cheap, there is a risk that the overall information base cannot provide
and there is a risk that infrastructure improvements are an unbiased measure of the overall state of the environment.
wrongly specified because of a lack of data to determine the Because of these changes in focus, analyses of long-term
design and operational requirements. changes in quality should be undertaken with caution.
Figure 6.14
The number of standard river invertebrate samples recorded 1990–2020. This record excludes samples
from investigations; additional samples were collected in 2020 but had not been analysed when this data
was collated in October 2021. This may give a low estimate for the 2020 value. Source: Environment Agency
290 | Freshwater Biology and Ecology Handbook
–