
Page 156 - Freshwater-Biology-and-Ecology-Handbook
P. 156
CHAPTER 3 3.1.4 3.1.4 River invertebrate classifications
Having devised the EQI format for biotic indices that is
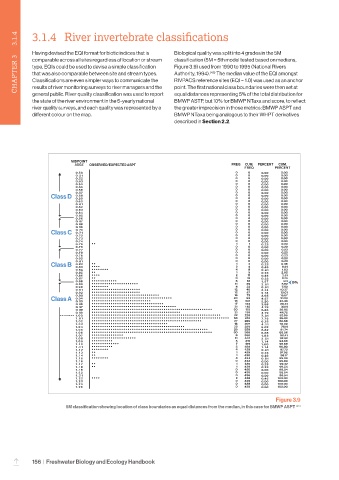
Biological quality was split into 4 grades in the 5M
classification (5M = 5th model tested based on medians,
comparable across all sites regardless of location or stream
Figure 3.9) used from 1990 to 1995 (National Rivers
type, EQIs could be used to devise a simple classification
that was also comparable between site and stream types.
(45)
Authority, 1994). The median value of the EQI amongst
RIVPACS reference sites (EQI = 1.0) was used as an anchor
Classifications are even simpler ways to communicate the
results of river monitoring surveys to river managers and the
general public. River quality classification was used to report
equal distances representing 5% of the total distribution for
BMWP ASTP, but 10% for BMWP NTaxa and score, to reflect
the state of the river environment in the 5-yearly national point. The first national class boundaries were then set at
river quality surveys, and each quality was represented by a the greater imprecision in those metrics: BMWP ASPT and
different colour on the map. BMWP NTaxa being analogous to their WHPT derivatives
described in Section 2.2.
MIDPOINT
AS0Z OBSERVED/EXPECTED ASPT FREQ CUM. PERCENT CUM.
FREQ PERCENT
0.50 0 0 0.00 0.00
0. 51 0 0 0.00 0.00
0.52 0 0 0.00 0.00
0.53 0 0 0.00 0.00
0.54 0 0 0.00 0.00
0.55 0 0 0.00 0.00
0.56 0 0 0 0 0.00 0.00
0.00
0. 57
Class D 0.58 0 0 0 0 0.00 0.00
0.00
0.00
0.59
0.60 0 0 0.00 0.00
0.00
0 .6 1 0 0 0.00 0.00
0.62 0 0 0.00 0.00
0.63 0 0 0.00 0.00
0.64 0 0 0.00 0.00
0.65 0 0 0.00 0.00
0.66 0 0 0.00 0.00
0. 67 0 0 0.00 0.00
0. 68 0 0 0.00 0.00
0. 69 0 0 0.00 0.00
Class C 0. 70 0 0 0 0 0.00 0.00
0.00
0 .7 1
0.00
0.7 2 0 0 0.00 0.00
0.7 3 0 0 0.00 0.00
0 .74 .. 0 0 0.00 0.00
0.75 1 1 0.23 0.23
0.76 0 0 0.00 0.23
0.7 7 0 0 0.00 0.23
0.78 0 0 0.00 0.23
0.79 0 0 0.00 0.23
0.80 0 0 0 0 0.00 0.23
0. 8 1
0.23
....
Class B 0.82 .. 2 1 2 4 0.00 0.46
0.23
0.83
0.91
..
0.84 ........ 4 8 0.46 1.83
0.9 1
0.85 .... 1 9 0.23 2.05
0.86 .. 2 11 0.46 2.51
0.87 ............ 0 12 0.23 2.74
0.88 ...................... 6 18 1.3 7 4.11 5%
0.89 ........ 11 29 2.5 1 6.62
0.90 ....................... 4 33 0.9 1 7.53
0. 9 1 ....................... 12 45 2 .74 10.27
13.01
0.92 ................................ 12 57 2 .74 16.67
73
16
Class A 0.93 ...................................... 20 107 3.65 24.43
............................
93
21.23
0.94
4.57
..................................
14
0. 95
3.20
0. 96 ........................................ 17 124 3.88 28.31
0. 97 ......................................................... 21 145 4.79 33.11
0. 98 .......................................... 30 175 6.85 39.95
0. 99 ............................................................. 21 196 4.79 44.75
1. 00 ................................................................. 32 228 7 .31 52.05
1 .0 1 .................................................... 34 262 7.7 6 59.82
1 .0 2 .................................... 27 289 6 .1 6 65.98
1. 03 ............................................ 18 307 4. 11 70.09
1. 04 ....................................................... 22 329 5.02 75.11
1 .0 5 ......................................................... 29 358 6.62 81.74
1. 06 ............... 30 388 6.85 88.56
1 . 07 ..................... 8 396 1.83 90.41
1 .0 8 .......... 11 407 2.5 1 92.92
1 .0 9 ............. 5 412 1. 14 94.06
1. 10 .......... 7 419 1.60 95.66
1. 11 ........ 5 424 1. 14 96.80
1. 12 .. 4 428 0.9 1 97.72
1. 13 .. 1 429 0.23 97.95
1. 14 ........ 1 430 0.23 98.17
1. 15 4 434 0.9 1 99.09
1. 16 .. 0 434 0.00 99.09
1. 17 .. 1 435 0.23 99.32
1. 18 1 436 0.23 99.54
1. 19 0 436 0.00 99.54
1.20 0 436 0.00 99.54
1.2 1 .... 0 436 0.00 99.54
1.2 2 2 438 0.46 100.00
1.23 0 438 0.00 100.00
1.2 4 0 438 0.00 100.00
1.25 0 438 0.00 100.00
Figure 3.9
5M classification showing location of class boundaries as equal distances from the median, in this case for BMWP ASPT (45)
156 | Freshwater Biology and Ecology Handbook
–