
Page 160 - Freshwater-Biology-and-Ecology-Handbook
P. 160
CHAPTER 3 3.2 – 3.3 3.2 How RIVPACS predicts an index
RIVPACS can predict the value of a wide range of biotic indices and the abundance and probability of occurrence of each
species and family of invertebrates, from the 12 environmental parameters listed in Table 3.4.
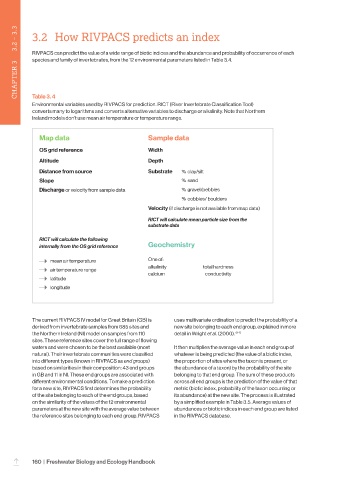
Table 3. 4
Environmental variables used by RIVPACS for prediction. RICT (River Invertebrate Classification Tool)
converts many to logarithms and converts alternative variables to discharge or alkalinity. Note that Northern
Ireland models don’t use mean air temperature or temperature range.
Map data Sample data
OS grid reference Width
Altitude Depth
Distance from source Substrate % clay/silt
Slope % sand
Discharge or velocity from sample data % gravel/pebbles
% cobbles/ boulders
Velocity (if discharge is not available from map data)
RICT will calculate mean particle size from the
substrate data
RICT will calculate the following
internally from the OS grid reference Geochemistry
mean air temperature One of:
alkalinity total hardness
air temperature range
calcium conductivity
latitude
longitude
The current RIVPACS IV model for Great Britain (GB) is uses multivariate ordination to predict the probability of a
derived from invertebrate samples from 685 sites and new site belonging to each end group, explained in more
the Northern Ireland (NI) model on samples from 110 detail in Wright et al. (2000). (44)
sites. These reference sites cover the full range of flowing
waters and were chosen to be the best available (most It then multiplies the average value in each end group of
natural). Their invertebrate communities were classified whatever is being predicted (the value of a biotic index,
into different types (known in RIVPACS as end groups) the proportion of sites where the taxon is present, or
based on similarities in their composition: 43 end groups the abundance of a taxon) by the probability of the site
in GB and 11 in NI. These end groups are associated with belonging to that end group. The sum of these products
different environmental conditions. To make a prediction across all end groups is the prediction of the value of that
for a new site, RIVPACS first determines the probability metric (biotic index, probability of the taxon occurring or
of the site belonging to each of the end groups, based its abundance) at the new site. The process is illustrated
on the similarity of the values of the 12 environmental by a simplified example in Table 3.5. Average values of
parameters at the new site with the average value between abundances or biotic indices in each end group are listed
the reference sites belonging to each end group. RIVPACS in the RIVPACS database.
160 | Freshwater Biology and Ecology Handbook
–