
Page 161 - Freshwater-Biology-and-Ecology-Handbook
P. 161
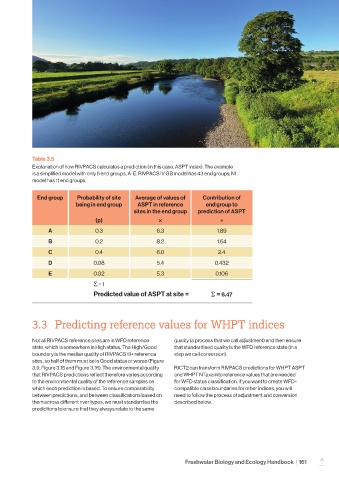
Table 3.5
            Explanation of how RIVPACS calculates a prediction (in this case, ASPT index). The example
            is a simplified model with only 5 end groups, A-E. RIVPACS IV GB model has 43 end groups; NI
            model has 11 end groups.


              End group     Probability of site   Average of values of   Contribution of
                            being in end group   ASPT in reference       end group to
                                                sites in the end group  prediction of ASPT
                                   (p)                   ×                    =
                  A               0.3                   6.3                  1.89
                  B               0.2                   8.2                  1.64
                  C               0.4                   6.0                   2.4

                  D               0.08                  5.4                 0.432
                  E               0.02                  5.3                  0.106

                                  Σ = 1
                                  Predicted value of ASPT at site =        Σ = 6.47


            3.3  Predicting reference values for WHPT indices


            Not all RIVPACS reference sites are in WFD reference   quality (a process that we call adjustment) and then ensure
            state, which is somewhere in High status. The High/Good   that standardised quality is the WFD reference state (in a
            boundary is the median quality of RIVPACS III+ reference   step we call conversion).
            sites, so half of them must be in Good status or worse (Figure
            3.9, Figure 3.15 and Figure 3.16). The environmental quality   RICT2 can transform RIVPACS predictions for WHPT ASPT
            that RIVPACS predictions reflect therefore varies according   and WHPT NTaxa into reference values that are needed
            to the environmental quality of the reference samples on   for WFD status classification. If you want to create WFD-
            which each prediction is based. To ensure comparability   compatible class boundaries for other indices, you will
            between predictions, and between classifications based on   need to follow the process of adjustment and conversion
            them across different river types, we must standardise the   described below.
            predictions to ensure that they always relate to the same


                                                                  Freshwater Biology and Ecology Handbook  |  161
                                                                                                                 –