
Page 67 - Freshwater-Biology-and-Ecology-Handbook
P. 67
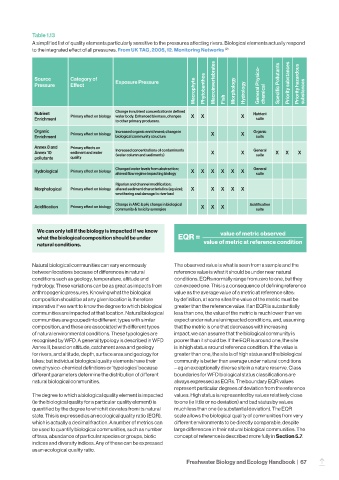
Table 1.13
            A simplified list of quality elements particularly sensitive to the pressures affecting rivers. Biological elements actually respond
            to the integrated effect of all pressures. From UK TAG, 2005, 12. Monitoring Networks  (2)


             Source       Category of
                                                                     Macrophyte  Phytobenthos  Fish  Morphology  Hydrology  chemical  substances
             Pressure     Effect          Exposure Pressure                 Macroinvertebrates  General Physico-  Specific Pollutants  Priority substances  Priority hazardous


             Nutrient     Primary effect on biology  Change in nutrient concentration in defined   X  X  X  Nutrient
                                          water body. Enhanced biomass, changes
             Enrichment                   to other primary producers.                      suite
             Organic      Primary effect on biology  Increased organic enrichment; change in   X  X  Organic
             Enrichment                   biological community structure                   suite

             Annex 8 and   Primary effects on
             Annex 10     sediment and water   Increased concentrations of contaminants   X  X  General   X  X  X
                                          (water column and sediments)
                                                                                           suite
             pollutants   quality
             Hydrological  Primary effect on biology  Changed water levels from abstraction;   X  X  X  X  X  X  General
                                          altered flow regime impacting biology            suite
                                          Riparian and channel modification;
             Morphological  Primary effect on biology  altered sediment characteristics (eg size);   X  X  X  X  X
                                          smothering and damage to river bed
                                          Change in ANC & pH; change in biological       Acidification
             Acidification  Primary effect on biology                   X  X   X
                                          community & toxicity synergies                   suite


              We can only tell if the biology is impacted if we know          value of metric observed
              what the biological composition should be under     EQR =
              natural conditions.                                        value of metric at reference condition


            Natural biological communities can vary enormously   The observed value is what is seen from a sample and the
            between locations because of differences in natural   reference value is what it should be under near natural
            conditions such as geology, temperature, altitude and   conditions. EQRs normally range from zero to one, but they
            hydrology. These variations can be as great as impacts from   can exceed one. This is a consequence of defining reference
            anthropogenic pressures. Knowing what the biological   value as the average value of a metric at reference sites:
            composition should be at any given location is therefore   by definition, at some sites the value of the metric must be
            imperative if we want to know the degree to which biological   greater than the reference value. If an EQR is substantially
            communities are impacted at that location. Natural biological   less than one, the value of the metric is much lower than we
            communities are grouped into different types with similar   expect under natural unimpacted conditions, and, assuming
            composition, and these are associated with different types   that the metric is one that decreases with increasing
            of natural environmental conditions. These typologies are   impact, we can assume that the biological community is
            recognised by WFD. A general typology is described in WFD   poorer than it should be. If the EQR is around one, the site
            Annex II, based on altitude, catchment area and geology   is in high status around reference condition. If the value is
            for rivers, and altitude, depth, surface area and geology for   greater than one, the site is of high status and the biological
            lakes; but individual biological quality elements have their   community is better than average under natural conditions
            own physico-chemical definitions or ‘typologies’ because   – eg an exceptionally diverse site in a nature reserve. Class
            different parameters determine the distribution of different   boundaries for WFD biological status classifications are
            natural biological communities.                   always expressed as EQRs. The boundary EQR values
                                                              represent particular degrees of deviation from the reference
            The degree to which a biological quality element is impacted   values. High status is represented by values relatively close
            (ie the biological quality for a particular quality element) is   to one (ie little or no deviation) and bad status by values
            quantified by the degree to which it deviates from its natural   much less than one (ie substantial deviation). The EQR
            state. This is expressed as an ecological quality ratio (EQR),   scale allows the biological quality of communities from very
            which is actually a decimal fraction. A number of metrics can   different environments to be directly comparable, despite
            be used to quantify biological communities, such as number   large differences in their natural biological communities. The
            of taxa, abundance of particular species or groups, biotic   concept of reference is described more fully in Section 5.7.
            indices and diversity indices. Any of these can be expressed
            as an ecological quality ratio.
                                                                   Freshwater Biology and Ecology Handbook  |  67
                                                                                                                 –