
Page 144 - Freshwater-Biology-and-Ecology-Handbook
P. 144
CHAPTER 3 2.2 2.2 WHPT (Walley Hawkes Paisley Trigg) indices
WHPT was developed as a more accurate and more precise
on expert judgement based on the limited knowledge that
was available in the late 1970s. WHPT makes use of more
replacement for BMWP for operational and surveillance
taxa than BMWP by using data from additional families
assessment and status classification, made possible
included in monitoring from about the year 2000.
because of data available from monitoring between 1990
and 2005. Better accuracy and precision were needed
because of the subtle but critical difference between
ability to detect moderate changes in invertebrate quality
Moderate and Good status, which is the boundary between The inclusion of abundance data improved the index’s
achieving and failing environmental quality objectives for associated with eutrophication, and it also improved
most water bodies. compliance with the WFD’s normative definitions. When
deriving WHPT index values, different abundances of the
The derivation of WHPT values from BMWP ASPT is same taxon were analysed as if they were different taxa.
described in Paisley et al. (2014). WHPT indices replaced For most taxa, there is a different value of WHPT for each
(41)
BMWP indices in time for the UK’s second River Basin RIVPACS abundance category (Table 3.1 & Table 3.2).
Management Plans, published in 2016.
Considering each abundance category of each taxon as
The accuracy and precision of biotic indices if it was a different taxon effectively narrowed the range
depends on: of conditions in which each ‘taxon’ was found. Taking
abundance into account in this way gives much more
• the accuracy of the index value assigned to each taxon precise results than simply applying a common abundance
• the number of taxa and individuals from which the index weighting factor.
is calculated at a site
• the narrowness of the range of conditions in which that To ensure the accuracy of WHPT index values, those based
taxon is found. on less than 75 records were removed before the definitive
WHPT index was finalised, as were values that caused a
WHPT values are far more accurate than BMWP values bimodal distribution across abundance categories. Both
mainly because they were derived from an analysis of a the index values calculated from the data and the definitive
huge set of field data from more than 100,000 standard values used operationally are listed in Paisley et al. (2014). (3)
quality-assured samples from across the UK, rather than
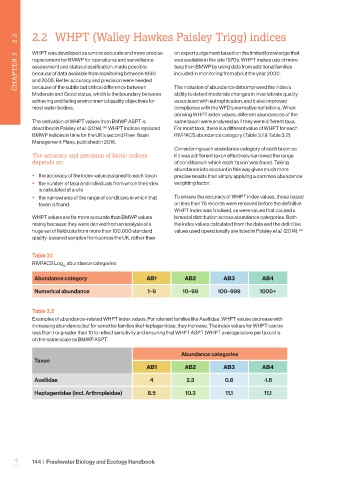
Table 3.1
RIVPACS Log abundance categories
10
Abundance category AB1 AB2 AB3 AB4
Numerical abundance 1–9 10–99 100–999 1000+
Table 3.2
Examples of abundance-related WHPT index values. For tolerant families like Asellidae, WHPT values decrease with
increasing abundance, but for sensitive families like Heptageniidae, they increase. The index values for WHPT can be
less than 1 or greater than 10 to reflect sensitivity and ensuring that WHPT ASPT (WHPT average score per taxon) is
on the same scale as BMWP ASPT.
Abundance categories
Taxon
AB1 AB2 AB3 AB4
Asellidae 4 2.3 0.8 -1.6
Heptageniidae (incl. Arthropleidae) 8.5 10.3 11.1 11.1
144 | Freshwater Biology and Ecology Handbook
–