
Page 163 - Freshwater-Biology-and-Ecology-Handbook
P. 163
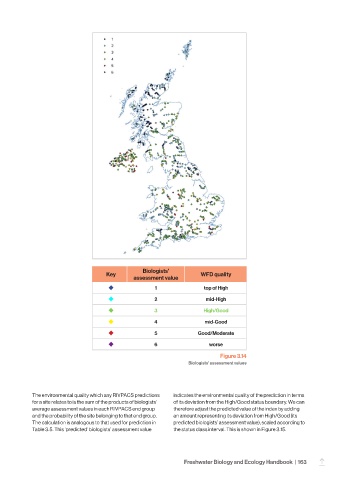
Biologists'
                                      Key                               WFD quality
                                                assessment value
                                                       1                 top of High

                                                       2                 mid-High
                                                       3                 High/Good

                                                       4                 mid-Good
                                                       5               Good/Moderate

                                                       6                  worse
                                                                              Figure 3.14
                                                                   Biologists' assessment values


            The environmental quality which any RIVPACS predictions   indicates the environmental quality of the prediction in terms
            for a site relates to is the sum of the products of biologists’   of its deviation from the High/Good status boundary. We can
            average assessment values in each RIVPACS end group   therefore adjust the predicted value of the index by adding
            and the probability of the site belonging to that end group.   an amount representing its deviation from High/Good (its
            The calculation is analogous to that used for prediction in   predicted biologists’ assessment value), scaled according to
            Table 3.5. This ‘predicted’ biologists’ assessment value   the status class interval. This is shown in Figure 3.15.


                                                                  Freshwater Biology and Ecology Handbook  |  163
                                                                                                                 –