
Page 164 - Freshwater-Biology-and-Ecology-Handbook
P. 164
CHAPTER 3 3.3.1 – 3.3.2 WFD status Bad midpoint Distribution of
O/E
0.50
0. 51
0.52
0.53
0.54
0.55
O/E in RIVPACS
0.56
0. 57
0.58
0.59
III+ GB + NI
0.60
0 .6 1
0.62
0.63
0.64
0.65
0.66
0. 67
0. 68
0. 69
Poor
0. 70
0 .7 1
0.7 2
0.7 3
0 .74
0.75
0.76 .. reference sites
0.7 7
0.78
0.79
0.80 ..
Moderate 0.82 ....
0. 8 1
........
0.83
0.84
....
0.85 .. In practice,
0.86 ..
............
0.87
RIVPACS 0.88 ...................... we only adjust
........
0.89
0.90
........................
0. 9 1 ........................ predictions
prediction Good 0.92 ................................ representing
.........................................
0.93
............................
0.94
..........................................
adjusted 0. 95 .................................. poorer quality
0. 96
............................................................
0. 97
0. 98
................................................................
0. 99 ..........................................
1. 00 ..................................................................
1 .0 1 ......................................................
to the median 1 .0 2 ....................................
............................................
1. 03
..........................................................
1. 04
1 .0 5 ............................................................
1. 06
quality at High 1 . 07 ................
......................
..........
1 .0 8
1 .0 9
..........
RIVPACS 1. 10 ..............
........
1. 11
1. 12
..
1. 13 ..
reference sites 1. 14 ........
1. 15
1. 16
..
1. 17 ..
1. 18
1. 19
1.20
1.2 1 ....
1.2 2
1.23
1.2 4
1.25
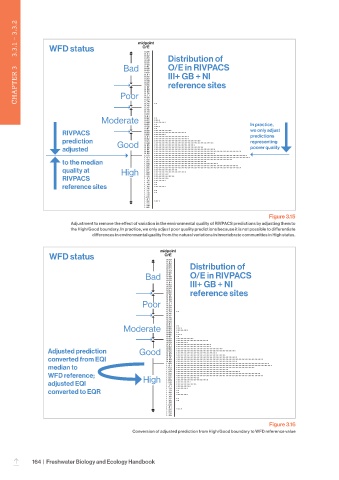
Figure 3.15
Adjustment to remove the effect of variation in the environmental quality of RIVPACS predictions by adjusting them to
the High/Good boundary. In practice, we only adjust poor quality predictions because it is not possible to differentiate
differences in environmental quality from the natural variations in invertebrate communities in High status.
midpoint
WFD status O/E
0.50
0. 51
0.52
0.53 Distribution of
0.54
0.55
0.56
Bad 0. 57 O/E in RIVPACS
0.58
0.59
0.60
0 .6 1 III+ GB + NI
0.62
0.63
0.64
0.65 reference sites
0.66
0. 67
0. 68
0. 69
Poor 0. 70
0 .7 1
0.7 2
0.7 3
0 .74 ..
0.75
0.76
0.7 7
0.78
0.79
0.80 ..
0. 8 1
Moderate 0.82 ....
........
0.83
..
0.84
0.85 ....
0.86 ..
0.87 ............
0.88 ......................
0.89 ........
0.90 ........................
0. 9 1 ........................
................................
0.92
Adjusted prediction Good 0.93 .........................................
............................
0.94
..................................
0. 95
............................................................
converted from EQI 0. 96 ..........................................
0. 97
..........................................
0. 98
................................................................
0. 99
median to 1. 00 ..................................................................
......................................................
1 .0 1
....................................
1 .0 2
............................................
1. 03
WFD reference; High 1. 04 ..........................................................
............................................................
1 .0 5
................
1. 06
......................
1 . 07
adjusted EQI 1 .0 8 ..........
..............
1 .0 9
..........
1. 10
........
1. 11
converted to EQR 1. 12 ..
..
1. 13
........
1. 14
1. 15
1. 16 ..
1. 17 ..
1. 18
1. 19
1.20
1.2 1 ....
1.2 2
1.23
1.2 4
1.25
Figure 3.16
Conversion of adjusted prediction from High/Good boundary to WFD reference value
164 | Freshwater Biology and Ecology Handbook
–