
Page 162 - Freshwater-Biology-and-Ecology-Handbook
P. 162
CHAPTER 3 3.3.1 3.3.1 Adjustment of predictions
In adjustment, we standardise the predictions at the
We can calculate the environmental quality to which a
prediction relates from biologists’ assessment values
environmental quality represented by High/Good status
(Figure 3.14). These quantify the environmental quality for
boundary, defined as the median value of the index or metric
each RIVPACS reference site when the reference samples
across all RIVPACS III+ reference sites (GB + NI + Highlands
and Islands), as explained in Section 4.2. This median is the
environmental quality that RIVPACS predicts most reliably.
Good boundary quality, in intervals of half-a-status class
(see key in Figure 3.14). Biologists’ assessment values
The adjustment acknowledges that WFD reference state were collected in terms of their deviation from the High/
is a specific environmental quality but not what that quality were estimated for every RIVPACS reference site using
is. The next step, conversion (Section 3.3.2), converts this contemporary environmental data (mostly chemical) and
standardised RIVPACS prediction to the environmental assessments by the biologists who collected the reference
quality defined by reference. samples, based on descriptive definitions covering water
quality, land use and, as a backstop, biological indicators.
Predictions for individual sites are adjusted by adding They were also screened against either the North Europe
or subtracting an amount that depends on how far the or the Central-Baltic Geographical Intercalibration Group
environmental quality of their predictions deviate from (GIG) type-specific chemical, flow and land cover criteria for
the High/Good boundary. We know the value of EQRs defining WFD reference state, depending on their hydro-
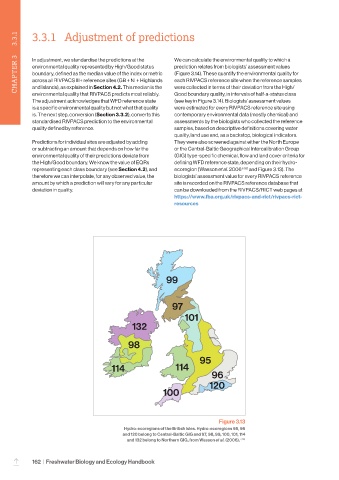
representing each class boundary (see Section 4.2), and ecoregion (Wasson et al. 2006 (48) and Figure 3.13). The
therefore we can interpolate, for any observed value, the biologists’ assessment value for every RIVPACS reference
amount by which a prediction will vary for any particular site is recorded on the RIVPACS reference database that
deviation in quality. can be downloaded from the RIVPACS/RICT web pages at
https://www.fba.org.uk/rivpacs-and-rict/rivpacs-rict-
resources
99
97
101
132
98
95
114 114
96
120
100
Figure 3.13
Hydro-ecoregions of the British Isles. Hydro-ecoregions 95, 96
and 120 belong to Central-Baltic GIG and 97, 98, 99, 100, 101, 114
and 132 belong to Northern GIG, from Wasson et al. (2006). (48)
162 | Freshwater Biology and Ecology Handbook
–